Table of Contents
Content Error or Suggest an Edit
Notice a grammatical error or technical inaccuracy? Let us know; we will give you credit!
Introduction
The following article will go through installing and updating Netdata on your WordPress server. I’ve also included information regarding platform-specific instructions for GridPane
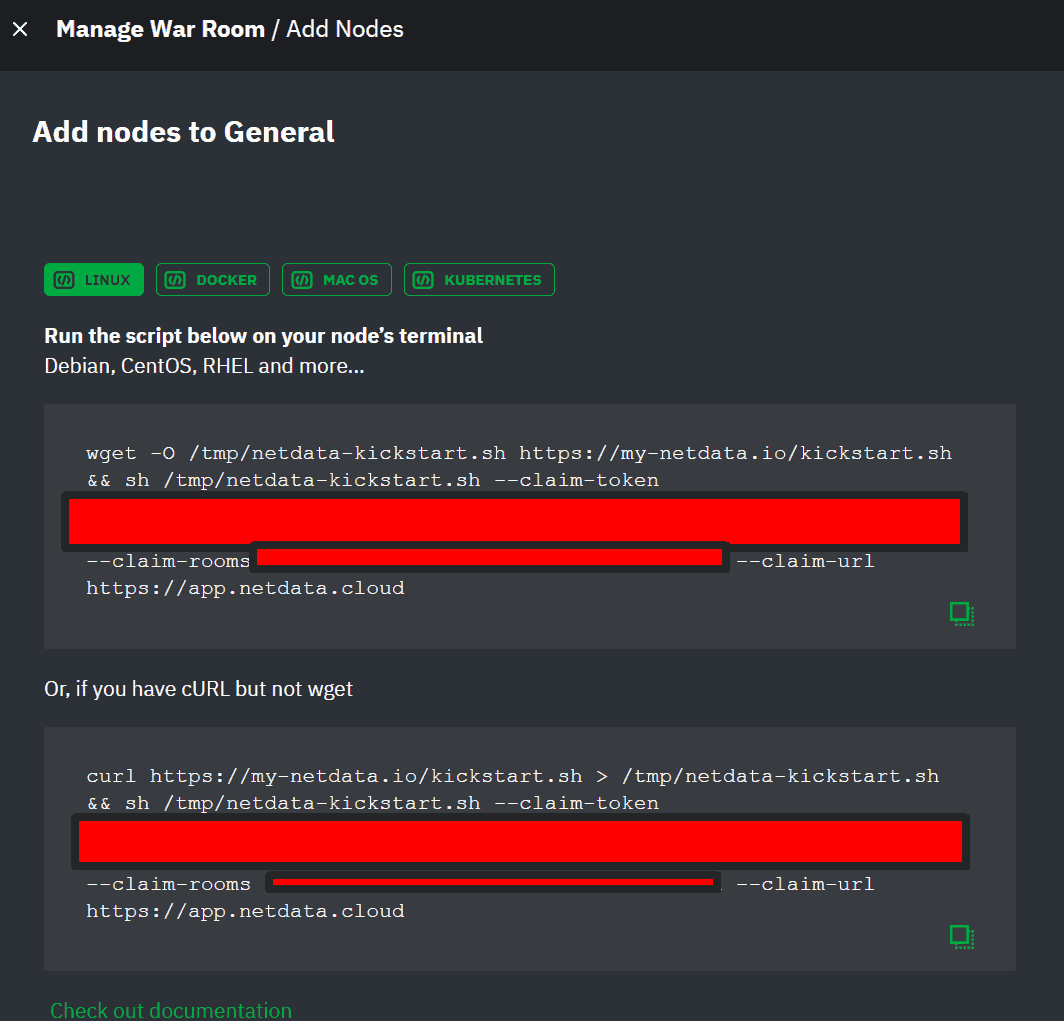
Installing Netdata
This part is easy once you sign up for Netdata, you’ll be given a command to run via SSH as root.
Servers with /tmp set to noexec
When installing or updating Netdata on instances with/tmp set to noexec for security reasons, you might encounter an issue. This is sometimes the case for GridPane systems and others. The following command will set a different temporary directory than /tmp for installation and updates.
Note, there isn’t a claim token provided, however once you run the following to install Netdata you can run the claim command provided for adding a node and it will detect the install and simply claim the host.
env TMPDIR=/root/tmp bash <(curl -Ss https://get.netdata.cloud/kickstart.sh)
Automatic Updates with /tmp set to noexec
You might also find that netdata’s automatic update via the cron process automatically uses the temporary directory location of /tmp by default and will fail.
To fix this, you simply need to run the command mentioned above which will run the netdata kickstart script in an alternative temp directory. It will then detect Netdata’s already installed and update it automatically as well as make sure future automatic updates use the alternative temporary directory.
Additional Notes
The following are environment variables that Netdata will seek when doing installations and updates.
NETDATA_TMPDIR_PATH="/root/tmp"
NETDATA_TMPDIR="/root/tmp"
TMPDIR="/root/tmp"
Other Useful Commands
Uninstall Netdata
* Uninstall netdata /usr/libexec/netdata/netdata-uninstaller.sh --yes
* Uninstall Everything Netdata sudo wget -O /tmp/netdata-kickstart.sh https://get.netdata.cloud/kickstart.sh && sh /tmp/netdata-kickstart.sh --uninstall --non-interactive
Disable Netdata Updates
wget -O /tmp/netdata-kickstart.sh https://get.netdata.cloud/kickstart.sh && sh /tmp/netdata-kickstart.sh --no-updates
Platform Specific Configuration
GridPane
DISCLAIMER
The following commands change how your GridPane server functions. This may void any support provide by GridPane, use at your own discretion. If you contact GridPane support, inform them that you made these changes.
Enable /stub_status (Netdata) and /nginx_status for (Nginx Amplify)
You will need to enable the stub_status module on your system. GridPane has this configuration in /etc/nginx/sites-available/222222 But I don’t know what it’s for. It’s not enabled at the moment, and we don’t want to touch this incase it’s utilized in the future.
So, instead, we’re going to create a custom file /etc/nginx/sites-available called nginx_status and add the contents below. Why two locations? The /stub_status is for Netdata, and the /nginx_status is for Nginx amplify. It all depends on what you want to use. I included both.
server {
    listen 127.0.0.1:80;
    server_name 127.0.0.1;
    # Netdata
    location /stub_status{
        stub_status on;
        access_log off;
        allow 127.0.0.1;
        deny all;
    }
    # Nginx amplify
    location /nginx_status{
        stub_status on;
        access_log off;
        allow 127.0.0.1;
        deny all;
    }
}
You then want to enable the site!
ln -s /etc/nginx/sites-available/nginx_status /etc/nginx/sites-enabled/nginx_status
Double-check that your syntax is correct by running nginx -t
❯ nginx -t
nginx: the configuration file /etc/nginx/nginx.conf syntax is ok
nginx: configuration file /etc/nginx/nginx.conf test is successful
Now you can restart Nginx and Netdata
systemctl restart nginx
systemctl restart netdata
You should now see statistics in Netdata.
Changelog
- 02-22-2024 – Renamed article from Installing Netdata on GridPane to Installing and Updating Netdata. Also restructured content.
Author

Jordan Trask
With 20 years experience in technology spanning from Linux, Data Center Infrastructure and related services and applications. Jordan consults with small, medium and large organizations tackling problems and technology needs. With 10 years experience in WordPress, he’s created Managing WP as a means to dump his brain on the web.
Jordan operates LMT Solutions providing Technology Consulting Services and We Power WP for WordPress Care Plans and Support.


