This page has had its content updated on May 15, 2025 EDT by Jordan
Table of Contents
- Introduction
- Understanding the WordPress Workload
- What are PHP Workers? And why do they matter?
- Dealing with High CPU and Memory on your WordPress site
- Potential causes for High CPU and Memory on your WordPress site
- 1. Poorly and Inefficient written Code
- 2. Remote API Slowdowns
- 3. Caching not Configured Properly
- 4. Your Server has Slow Storage
- 5. MySQL InnoDB Buffer Pool and Insufficient Server Memory
- 6. Wasteful Traffic
- 7. Your Server doesn’t have a modern High-Frequency Processor
- 8. You’re actually getting more traffic.
- Potential causes for High CPU and Memory on your WordPress site
- Tools and Services to Help Identify High CPU or Memory Usage
- Monitoring and Alerting CPU and Memage Usage
- Changelog
Content Error or Suggest an Edit
Notice a grammatical error or technical inaccuracy? Let us know; we will give you credit!
SSH and Linux Shell Knowledge Required
This article requires a basic understanding of connecting to a server through SSH and issuing Linux Shell commands using Bash.
Introduction
You’re here because you’re dealing with a single WordPress site or a server that is utilizing too much CPU or Memory. If it’s the former and you’ve identified the site in question, you’re in a better position. If it’s the latter, you’ll have a little more investigation and potentially a bigger issue on your hands. But don’t panic; there is a path forward.
This article aims to provide you with the tools and explanation to find the cause of high CPU or Memory usage on your WordPress site or Server (VM, Baremetal) and not just deal with the symptoms.
Understanding the WordPress Workload
What is a Workload?
When discussing a piece of software and its requirements to operate on a server, the term typically used is workload. For most software, the workload can be calculated using a data point, such as how many users are online or how many requests per second. From there, you can size your server accordingly and make appropriate decisions when there’s a demand of traffic.
However, with software like WordPress, it’s nearly impossible because it’s so extendable, which is also one of its major features. Every WordPress site will act and utilize resources in a different manner depending on the plugins and themes installed. This can also change over time as new plugins or custom code is added and when plugins receive updates. How a WordPress site acts today can change in weeks or months.
Each WordPress Sites Requirement for Resources is Unique
For example, let’s take two servers and 80 random WordPress sites, ranging from single-page brochure sites to WooCommerce or Membership sites. Let’s shuffle the 80 WordPress sites and place 40 on one server and 40 on another. The 40 WordPress sites on one server versus 40 WordPress sites on the other will require different resources; server one can operate on 4 CPU cores while server two needs 16 CPU cores. You could randomize the 80 WordPress sites again, and more often than not, you won’t find a perfect balance. Furthermore, depending on traffic and plugins or custom code added, the resource usage on both servers will change in a month.
How can I choose the right amount for Server Resources for my WordPress sites?
There are a couple of golden rules you can stick to that will help you succeed in matching your server’s CPU and Memory to your WordPress sites.
- It’s better to group WordPress sites by type. As mentioned before, single-page brochure sites, multiple-page sites, WooCommerce, Membership, and High Traffic. The number of CPU cores and Memory you need for 39 single-page brochure WordPress sites with 10 plugins is going to be different than 5 WooCommerce WordPress sites with 30-50 plugins.
- Caching, specifically server-side caching it will always outperform plugin caching due to being close to CPU and will utilize memory which is faster than disk. Even when using Redis and a caching plugin. For single-page brochure WordPress sites, it will also mean one less plugin. You could theoretically run 60 brochure sites on a 4 CPU server; however, if 5 of those site owners log in and update their WordPress site, you might see a slowdown.
- Start with an estimate, do some math, monitor resources closely, and then upgrade when required. I always suggest 4 CPU cores, you can stretch it with 2 CPU cores but during spikes those extra 2 CPU cores will help
- Stick to high-frequency processors; they might not be needed for single-page brochure sites as most requests come from the cache. However, they will quicker process any non-cached PHP requests, freeing up PHP workers for other tasks. You could also use less CPU cores to service the same workload at the same price.
What are PHP Workers? And why do they matter?
Here’s ChatGPT’s explanation, which is pretty accurate.
PHP workers are responsible for executing PHP code and generating dynamic content in response to user requests. When a user accesses a PHP-based web page, the web server (such as Apache or Nginx) receives the request and hands it over to a PHP worker to process. The worker executes the PHP code, interacts with databases or other resources, and generates the HTML or other content to be sent back to the user’s browser.
There are defaults for PHP Workers for most WordPress hosting platforms that are a god baseline for small sites. However, when those small sites receive more traffic, then the PHP Worker limit will be hit and you’ll need to increase the limit if you have enough server resources.
Why does this matter? Typically in situations where there is a server resource issue such as high CPU or Memory usage, you’ll upgrade your server and the resource issues go away but now your site is returning error messages. You now need to change your PHP Worker configuration to utilize the new resources.
Example PHP Workers Configuration (Screenshots)
WordPress sites’ most popular hosting stacks will utilize Nginx and PHP-FPM or Litespeed/Openlitespeed and LSPHP. Both use PHP workers to handle requests, below are the configuation options from GridPane.


PHP Workers and the Grocery Store Analogy
Imagine a grocery store; you have 12 lanes total (total max PHP workers) and each lane can only service one person (request) at a time. Once all lanes are servicing a person, if a new person tries to checkout they are told to go away. In the real world, this would never happen, but in the PHP Worker world it does.
The goal of this grocery store is that no one should be told to go away unless there are no lanes available. There is by default 1 lane open (Start Servers) then as more requests come in, you open up more lanes until you reach your total max lanes of 8 at wich point you turn people away (requests). In this situation you can always create more lanes (workers), but that requires more real estate (more CPU cores).
Depending, you might have more real estate (CPU) and you just open up new lanes (change Max Children). You can even build on-top of existing lanes (overcommiting) if you don’t have enough real-esate (CPU) but it will slow all the lanes down to the point your checkouts are taking longer to complete.
Dealing with High CPU and Memory on your WordPress site
So how do we deal with a situation where the CPU and Memory on your WordPress site are higher than normal?
What most people do is throw more resources at the problem, which works if you have the budget and you don’t care why High CPU and Memory issues are now occurring. However, treating the symptoms without knowing the cause, might mean the symptoms will reappear.
Potential causes for High CPU and Memory on your WordPress site
Here’s a good checklist to consider when troubleshooting high CPU or Memory on your WordPress site. It’s quite possible that one item might be causing your issues, or it’s a handful.
1. Poorly and Inefficient written Code
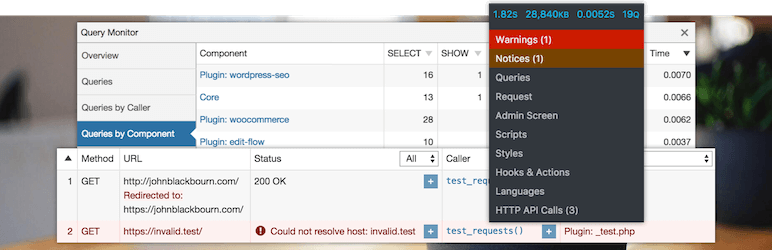
There could be an issue with poorly written code, such as a function taking 5-10 seconds to complete on each request and utlizing a good amount of CPU or even memory. Using PHP-FPM slow query logging or Query Monitor to find the function or MySQL query causing the slowdown.
2. Remote API Slowdowns
Just as poorly written code within your WordPress site can cause CPU usage issues on server, slow responding Remote API’s can have the appearance of your WordPress site running slowly. When in reality your servers CPU and Memory usage is not high at all.
As mention above, you can look at PHP-FPM slow query logging or Query Monitor to find the API slowdown. There are additional plugins available and recorded in the wiki.

3. Caching not Configured Properly
You might also want to investigate your cache settings, and ensure that you’re caching appropriately. Check that you have full page caching, object caching, and PHP OPcode cache setup and tunned.
Caching is important as there are repetative requests that can be cached as they don’t produce unique data, and if you’re not caching these requests you’re wasting your precious CPU and Memory resources.
4. Your Server has Slow Storage
Also know as I/O starvation, if your WordPress site is on slow storage then the CPU has to wait for the storage to catch up. This is also know as I/O wait of which you can see within top and htop. You want to ensure that your server is backed with flash storage like SSD or even better NVMe and that it’s not oversubscribed by your hosting provider.
5. MySQL InnoDB Buffer Pool and Insufficient Server Memory
InnoDB cache, also known as the InnoDB buffer pool, enhances the performance of database operations, particularly read-heavy operations, by minimizing the need to access data from disk. The InnoDB cache stores frequently accessed data in memory in the buffer pool. This data can include indexes, table data, and even frequently executed SQL queries. When a query is executed, MySQL first checks if the required data is already present in the InnoDB cache. If it is, the data can be directly retrieved from memory, significantly speeding up the query execution process.
When your databases fit entirely within the InnoDB cache, queries that require data from these databases are served instantaneously from memory. This eliminates the latency associated with fetching data from disk. It’s important to allocate enough memory to accommodate your databases, if your database size exceeds the available memory, some data will need to be fetched from disk.
You will need to contiually monitor your databases size, and increase your serves memory as well as update the innodb buffer pool configuration to utilize this increase in memory.
6. Wasteful Traffic
What is wasteful traffic? Any traffic that comes to your site that doesn’t serve a valid purpose and takes up resources. Here is a good list of common wasteful traffic a WordPress site might see.
- Bad bots crawling and indexing your site causing a spike in resources.
- Headless WordPress xml-rpc.php queries.
- Headless WordPress /wp-login.php and /wp-admin requests.
The last two items mention headless, this essentially means they’re not using a browser and are automated attacks. For smaller sites the impact might not be enough to cause issues, but high traffic sites might see more of these requests and will increase resources. Since these requests aren’t cached, PHP is being triggered and therefore wasteful as the request isn’t servicing a valid user.
You can block these requests at your hosting provider if they provide such features or you can use something like Cloudflare. Check out our article on securing, protecting and locking down your WordPress site with Cloudflare.

7. Your Server doesn’t have a modern High-Frequency Processor
Not all hosting providers are using the most modern or even High-frequency processors for their base plans. WordPress uses PHP and PHP will compile each request, as such more modern high frequency processors are ideal for faster load times. So review what processor you have, not only the frequency, but also the age of the processor.
A processor running at 3GHz from 2015 doesn’t match the speed of a 3GHz processor from 2022, and this difference extends to the presence of more recent instruction sets in the latter. Instruction sets consist of a series of commands that a processor can carry out. These newer instruction sets are typically designed to offer a more efficient approach to task completion, often streamlining processes that would otherwise require multiple commands and more time on older instruction sets.
Some vendors don’t provide processor information up-front, so you have to login to your instance via SSH to get this information. It’s also possible that they mask this information, which means you have to put in a support request and ask of which they may or may not tell you. Another quick way to figure this out is to simply run a benchmark, and compare it to https://www.cpubenchmark.net/ for example.
A Faster CPU will speed up requests, and free up workers quicker to be available for the next request. This inturn will help with the overall CPU usage, if requests are completing faster then the CPU is waiting for requests instead of queuing up requests and increasing
8. You’re actually getting more traffic.
Adding more resources in this situation isn’t wrong, traffic does increase. But you need to ensure that this is actually the issue, so leave this as a last step or you might come to the conclusion when you exhaust the other items in this list. You should have some sort of metrics in place to verify this, utilize Google Analytics or a similar analytics platform. You can also use Netdata and review how your server is handling traffic, and if it’s increased. I talk about Netdata at the end of this article.
Tools and Services to Help Identify High CPU or Memory Usage
Now, I won’t discuss identifying whether your server has a problem with High CPU usage. The tools below are meant to help you track down the source of the High CPU or Memory usage. As for monitoring and alerting for High CPU and Memory, I will cover this later in the article.
Tools for Snapshot and Real-time CPU and Memory Usage Issues
The following tools will provide a snapshot of your systems processes CPU and Memory usage, as well as realtime data. It will include important information such as usernames, pids, start time of process and the full command line of the process.
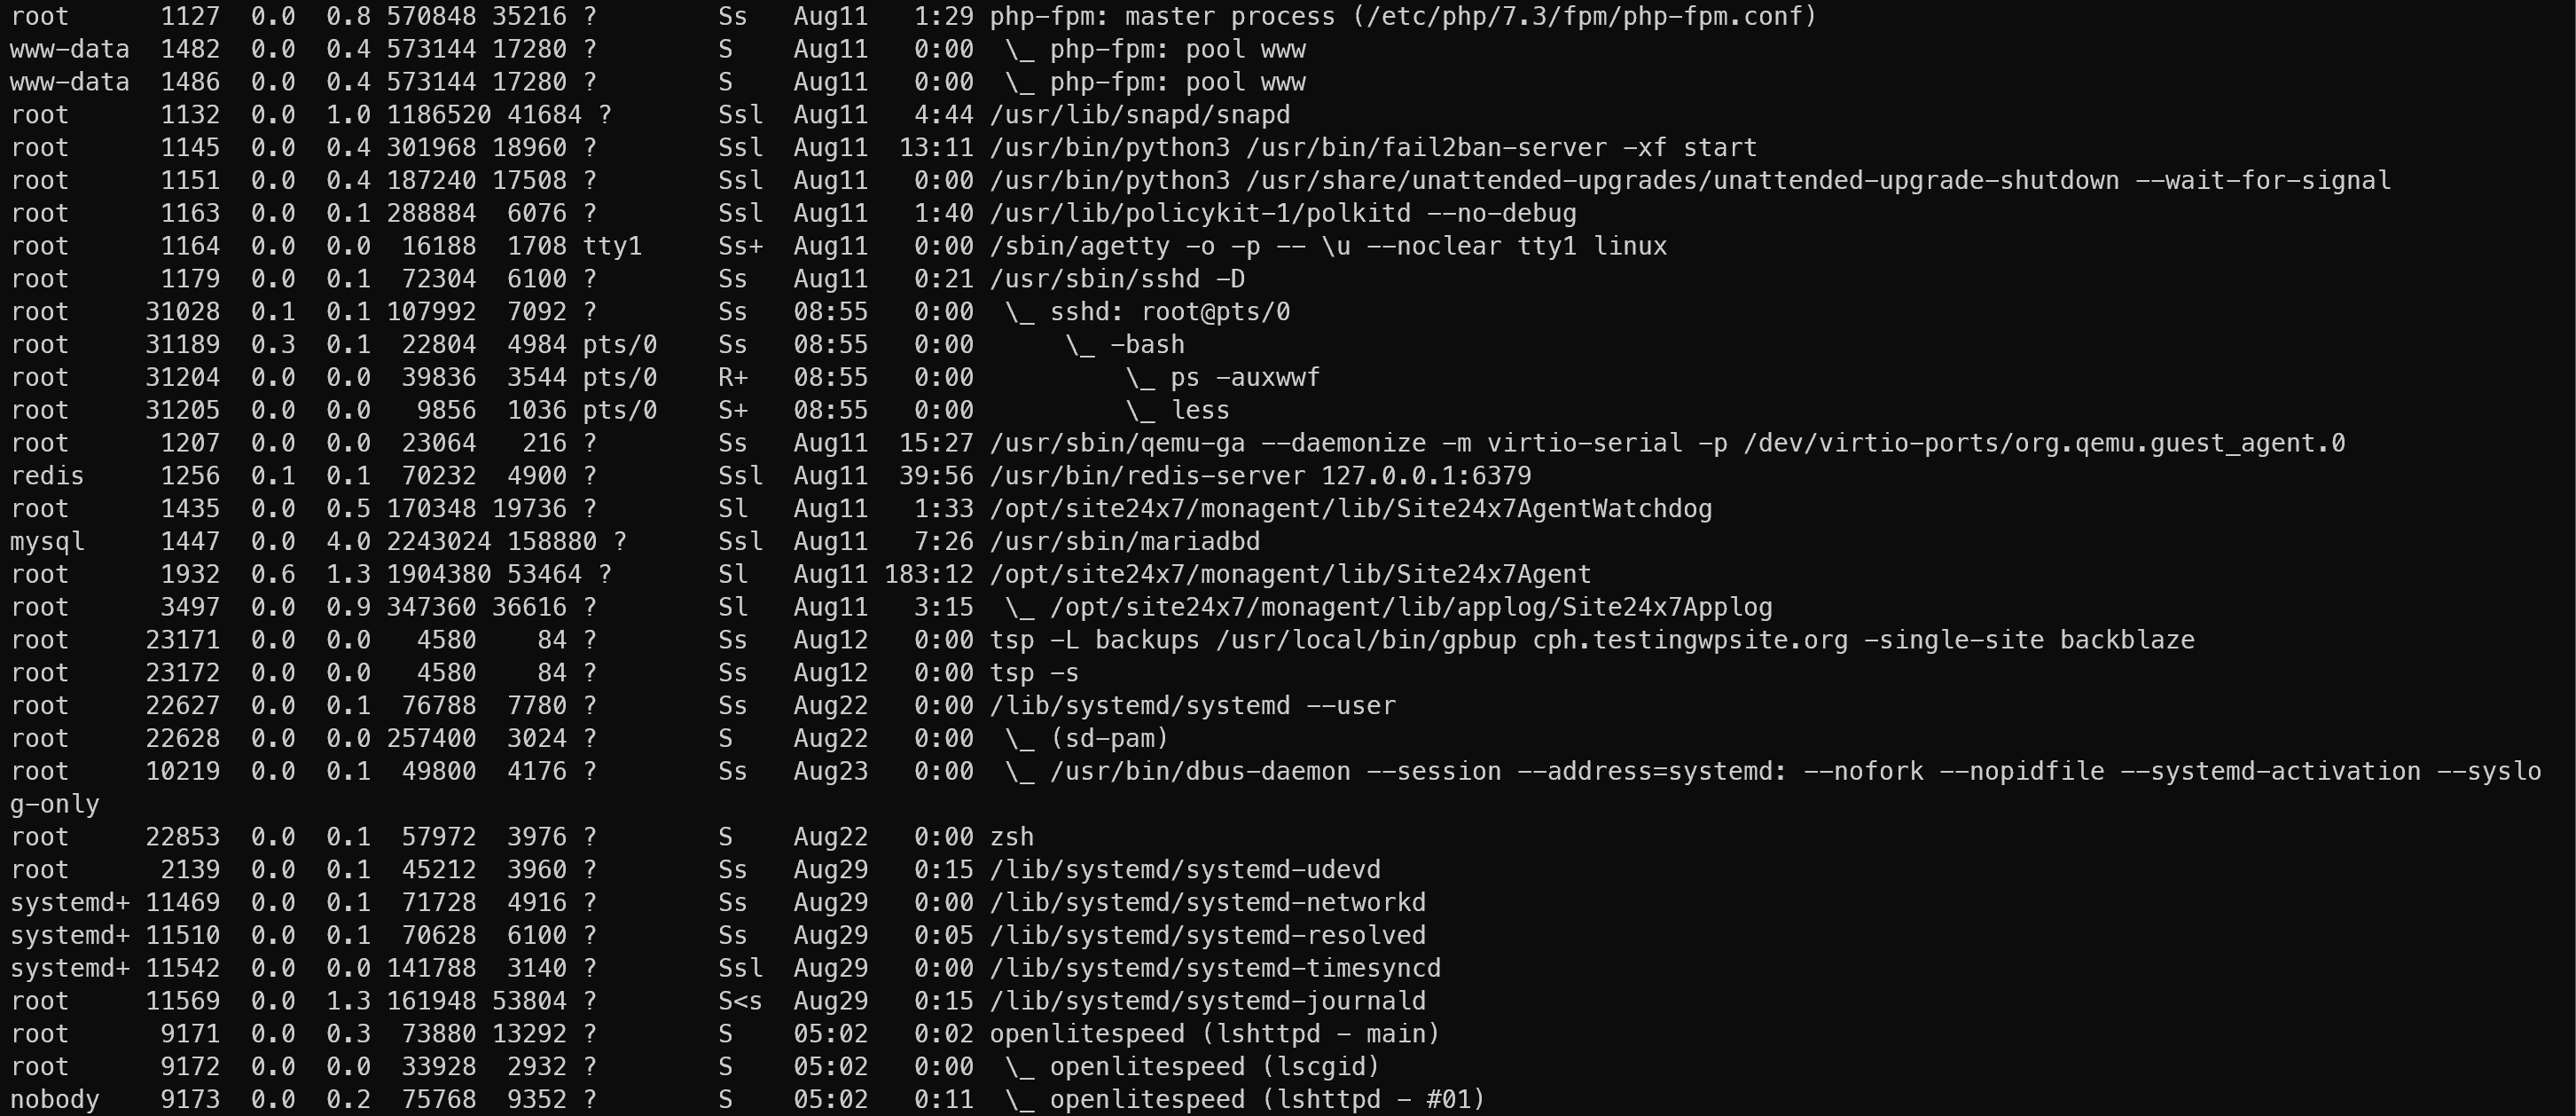
1. Linux ps Command
This command lets you view all the processes and threads on a Linux system in a tree view. The default output of running the command provides limited information, so you’ll want to use the following commands.
List all Processes with ‘ps’
\ps -auxwwf
- \ = This will bypass any aliases that are set to ps that might cause an error.
- -a = Select all processes except both session leaders (see getsid(2)) and processes not associated with a terminal.
- -u = Display user-oriented format.
- -x = this option causes ps to list all processes owned by you (same EUID as ps), or to list all processes when used together with the a option.
- -w = Wide output. Use this option twice for unlimited width.
- -f = Do full-format listing.
List all Processes without Truncating Usernames
The following will expand the user column so that it’s not truncated.
\ps -eo user:32,pid,%cpu,%mem,cmd --forest
List Top 15 CPU Processes
The following command will list the top 15 CPU processes.
\ps -eo user:32,pid,%cpu,%mem,cmd --forest | { read h; echo "$h"; tail -n +2 | sort -nrk3,3 | head -n15; }

- We’re using the same code in #1 but ensuring usernames aren’t truncated.
- \ = This will bypass any aliases that are set to ps that might cause an error.
- sort -nrk 3,3
- -n = numeric sort
- -r = reverse the result of comparisons
- -k = sort via a key; KEYDEF gives location and type
- 3,3 = column 3, data 3 which is the CPU column
2. The top command using ps (Fake top)
The biggest issue with top, htop or atop is the username for processes is truncated. You can get a snapshot with usernames not truncated using ps, but it doesn’t update every n seconds. However, you can use the following code below to create a fake top that doesn’t truncate users and provides just the right information
ps-top() {
  	# Help flag
	_ps-top-usage () {

		echo "Usage: ps-top [interval] [cpu|mem] [topN]"
		echo "  interval: Time in seconds to refresh (default: 2)"
		echo "  cpu|mem: Sort by CPU usage or memory usage (default: cpu)"
		echo "  topN: Show top N processes (default: 0, show all)"
		echo "  -h, --help: Show this help message"
		echo "  Example: ps-top 2 cpu 10"
	}

	if [[ $1 == "-h" || $1 == "--help" ]]; then
		_ps-top-usage
		return 0
	fi

	local INTERVAL="${1:-2}"
	local SORTFIELD="${2:-cpu}"
	local TOPN="${3:-0}"
	local SORTCOL TOPCMD CMD

	case "$SORTFIELD" in
		cpu) SORTCOL=3 ;;
		mem) SORTCOL=4 ;;
		*)
		echo "Invalid sort field: '$SORTFIELD' (use cpu or mem)"
		return 1
		;;
	esac

	if (( TOPN > 0 )); then
		TOPCMD=" | head -n $TOPN"
	else
		TOPCMD=""
	fi

	CMD="ps -eo user:32,pid,%cpu,%mem,cmd --forest \
		| { read -r header; echo \"\$header\"; tail -n +2 \
			| sort -nrk${SORTCOL},${SORTCOL}${TOPCMD}; }"

	watch -n "$INTERVAL" "$CMD"
}
To run the command just type the following.
ps-top

To make this persistent after you logout and log back in again, you can add it to your .bash_profile .bashrc or .profile file in your home folder.
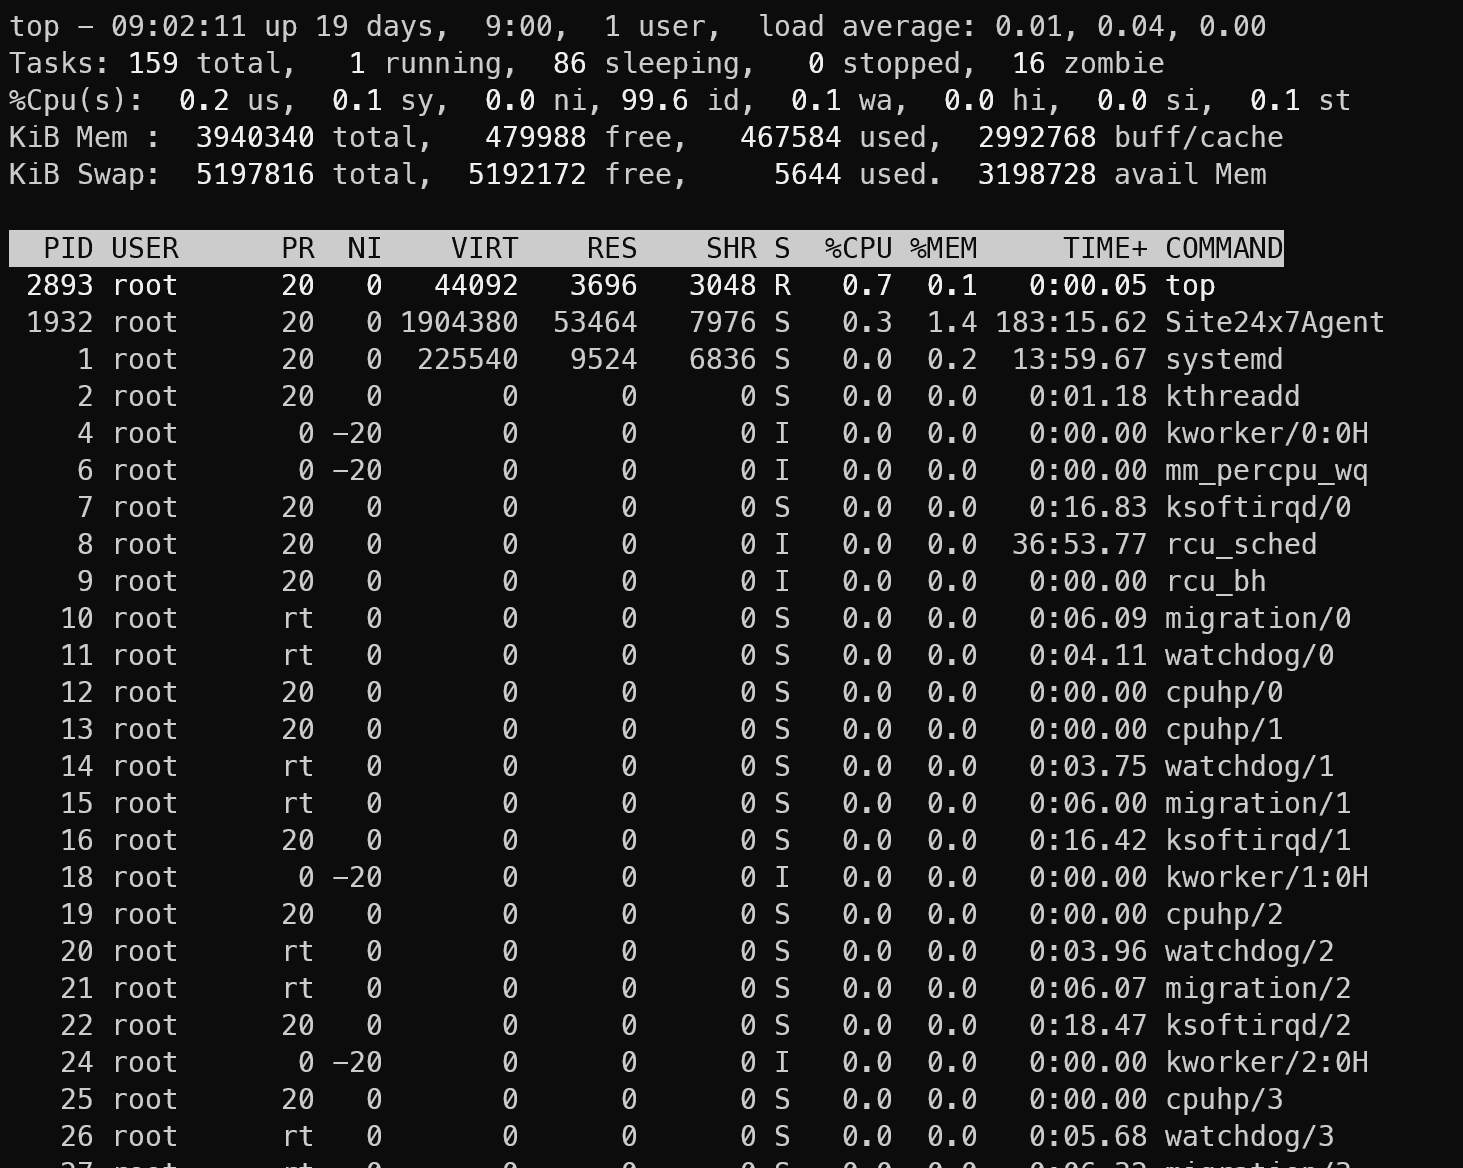
3. Linux top Command
The top command in Linux will provide you with a real-time view of the running processes on a system and refresh every 3 seconds. It’s a great tool when you quickly need to figure out what is going on resource-wise on a Linux system.
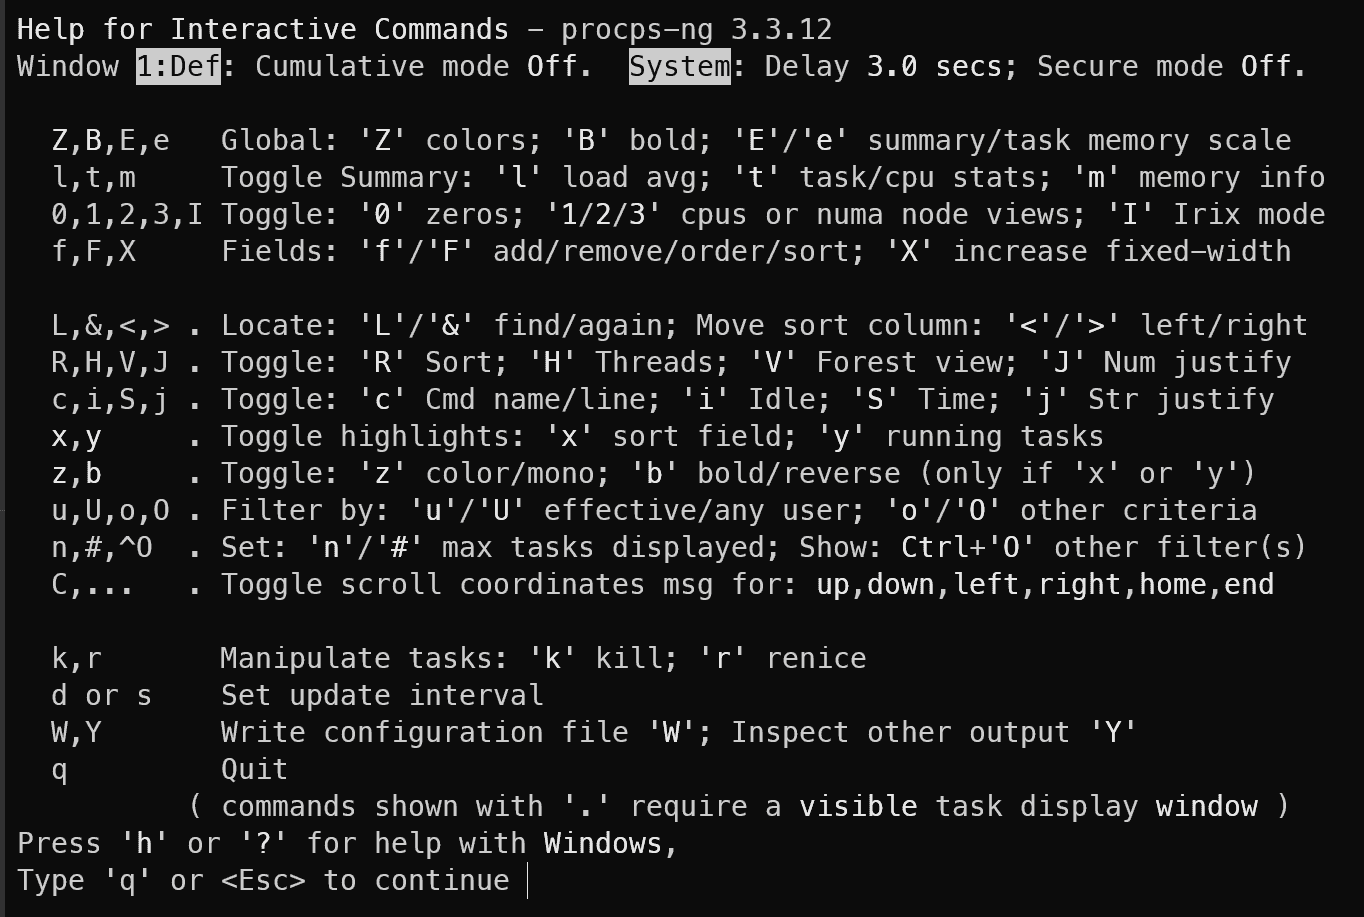
You can press “shift + ?” to get to the help screen, which provides instructions on how to control the output, including sorting based on fields such as %CPU
The top (table of processes) command shows a real-time view of running processes in Linux and displays kernel-managed tasks. The command also provides a system information summary that shows resource utilization, including CPU and memory usage
4. Linux “htop” command
The Linux htop command is top on steroids, providing some improvements to the top command such as color, displaying of CPU cores/Memory as usage graphs.
Htop is an interactive real-time process monitoring application for Linux/Unix-like systems and also a handy alternative to top command, which is a default process monitoring tool that comes pre-installed on all Linux operating systems.
https://www.tecmint.com/htop-linux-process-monitoring
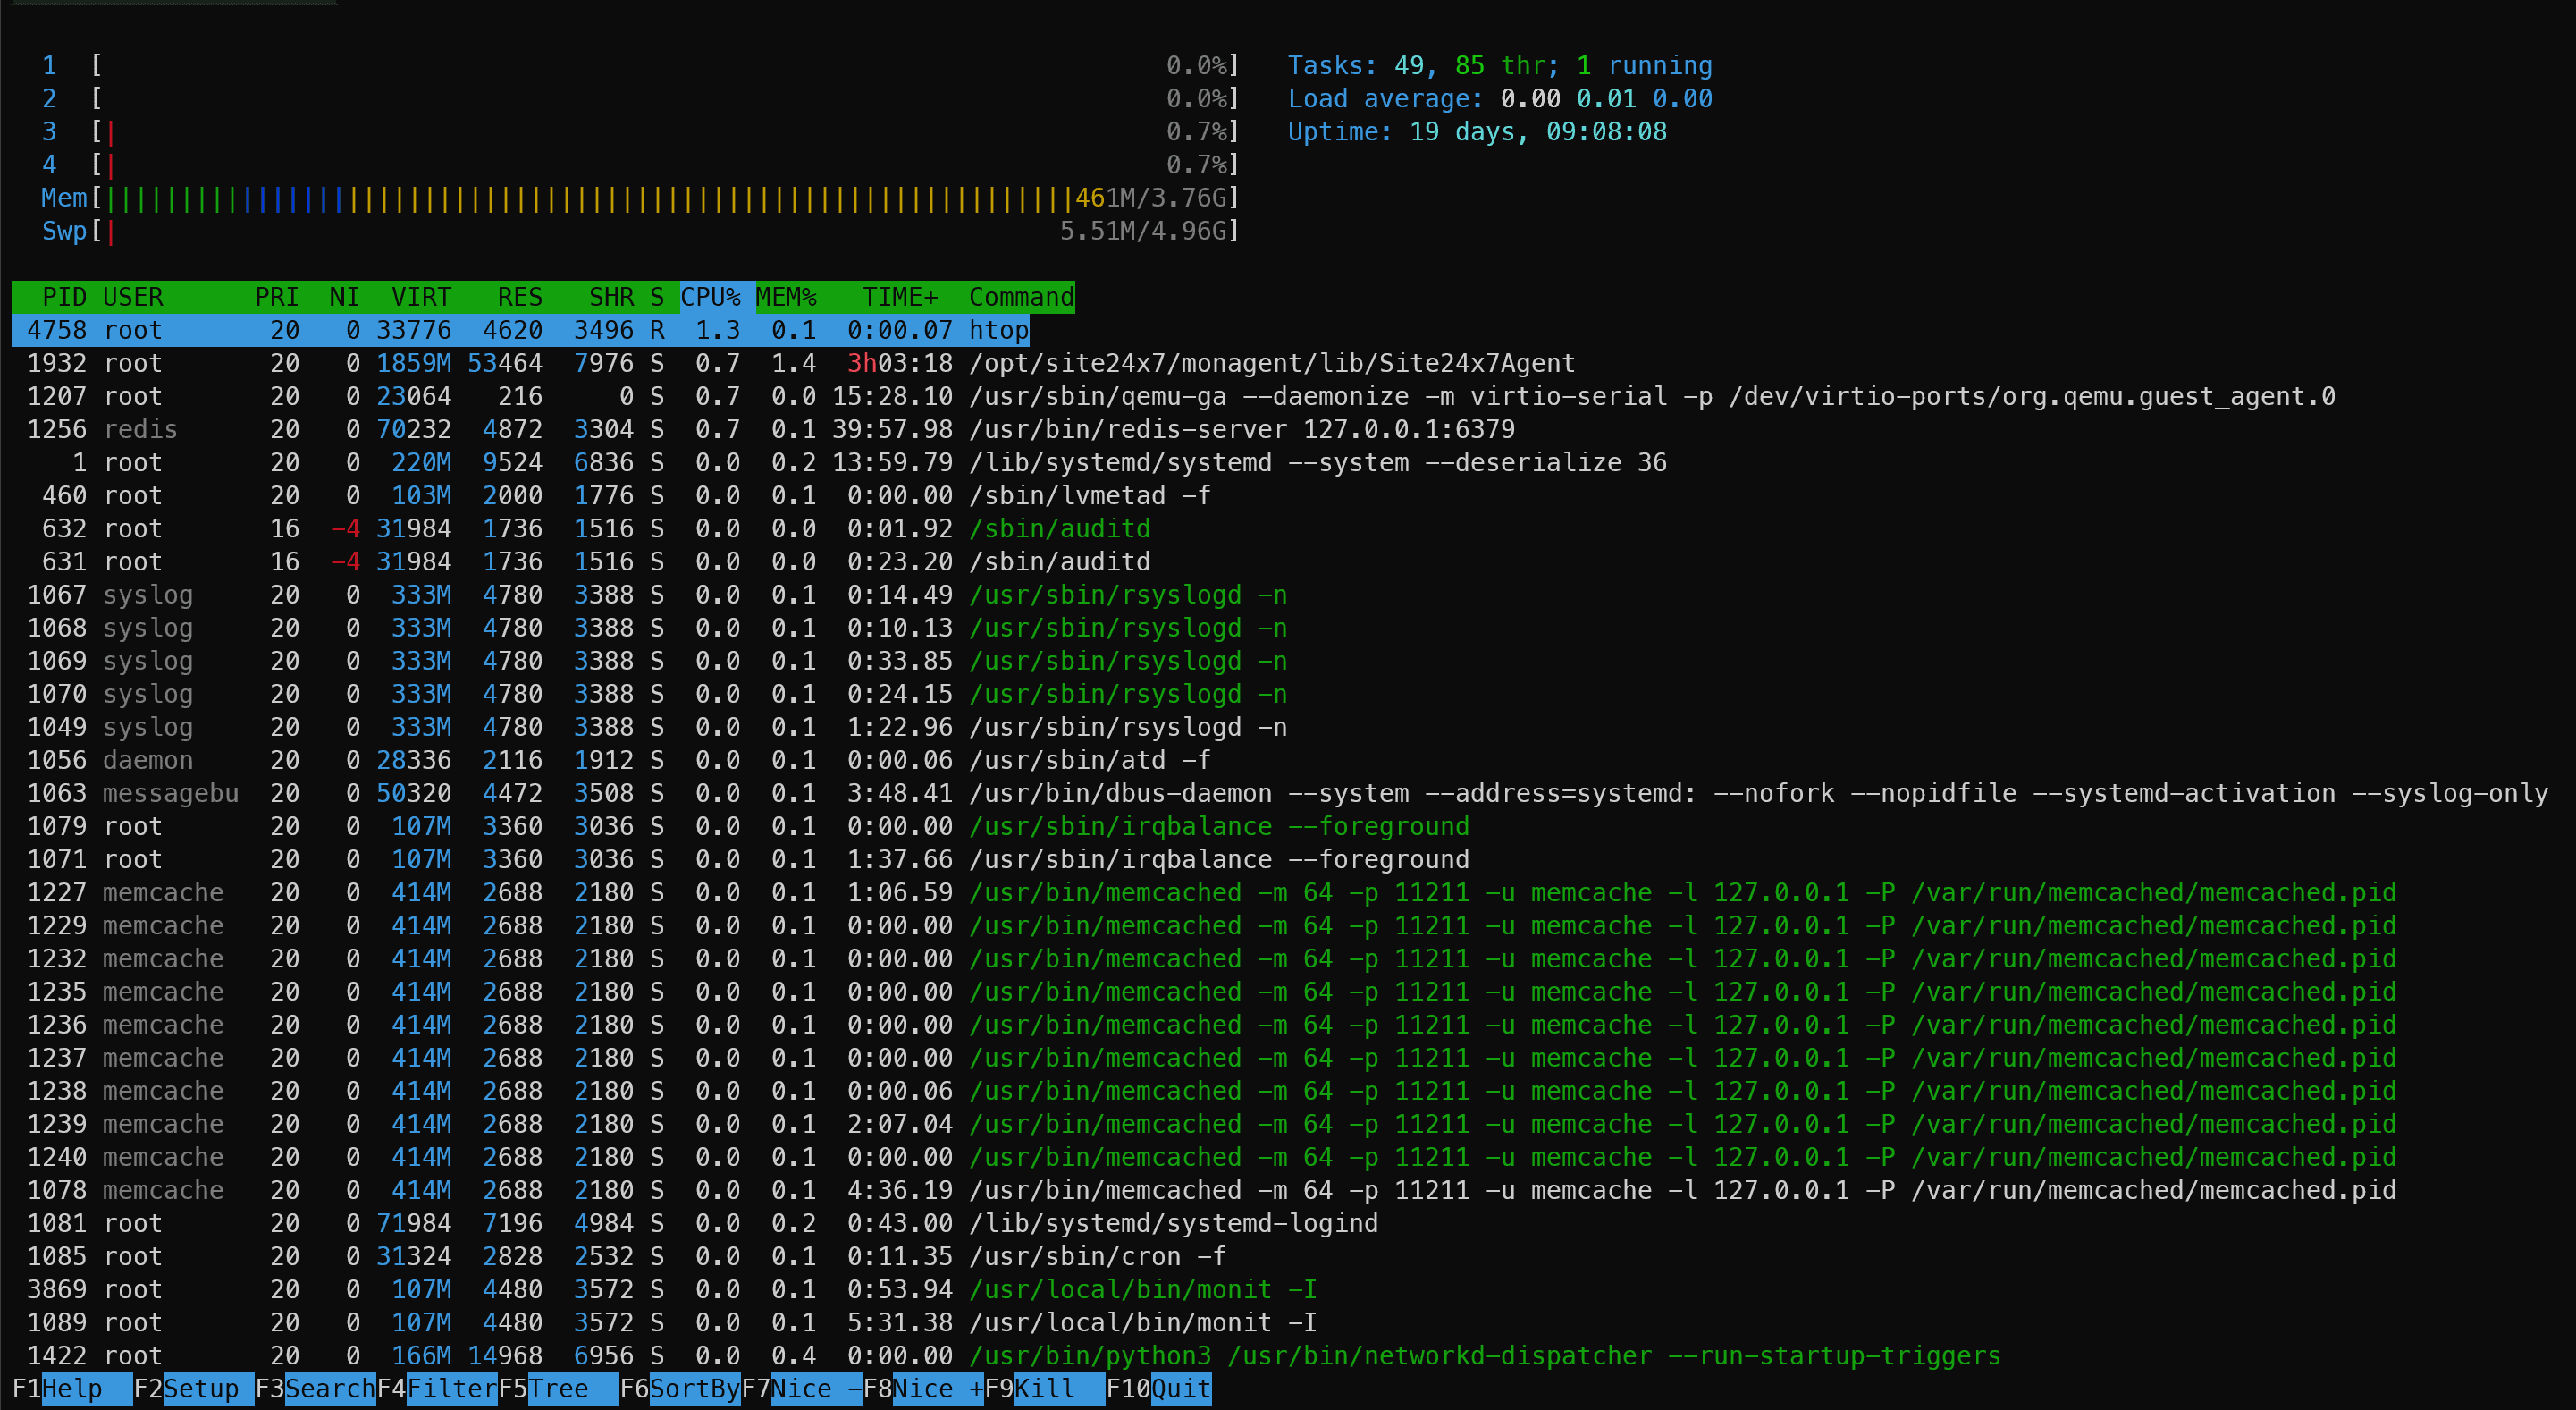
Typically, htop is whatever one recommends and uses due to its easy-to-read UI.
Caveat: htop Username truncation
Unfortunately htop truncates the username to 8 chars, and there is no way to adjust this. You can however configured htop.
- Press F2
- Arrow down to ‘screen’
- Right Arrow Twice to get to the list of options, and select ST_UID

This will persist next time you open htop, but you can also create a new screen that just shows USER and Command, of which you can access with tab. Here is an example.

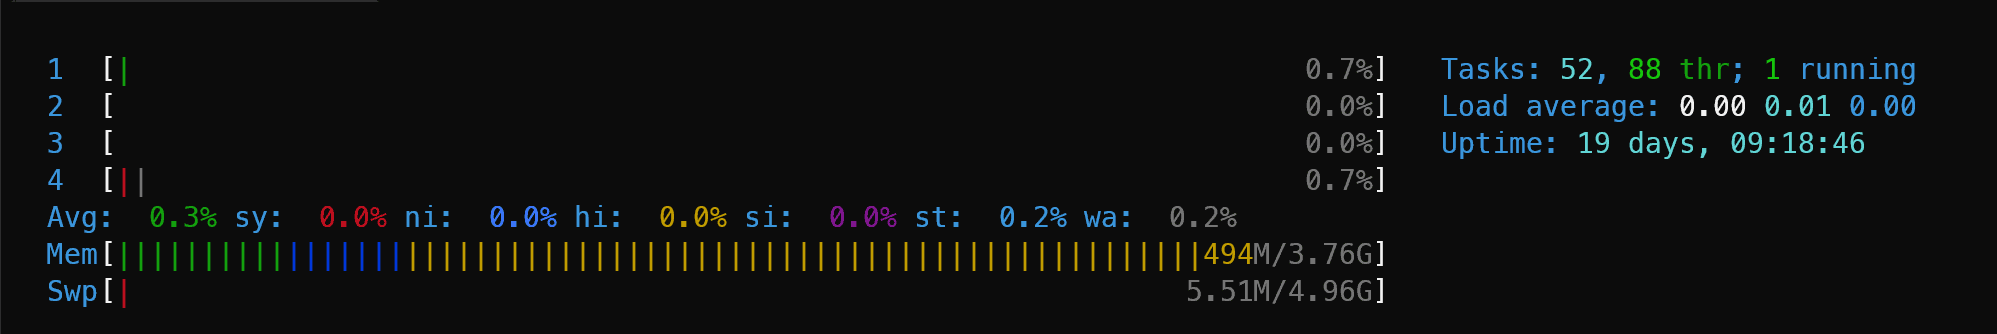
Caveat: htop CPU Steal
However, there is one caveat, CPU steal isn’t displayed by default and has to be turned on. This GitHub issue explains how to enable “Detailed CPU time”, and then how to change the CPU graph from bar to text. You can also add the “CPU Average” meter and change it to text as it’s smaller https://github.com/hishamhm/htop/issues/369
Here’s what it looks like once you make the change.
Caveat: htop unable to sort on CPU usage in tree mode.
Another caveat is that you can’t display processes in tree view and sort on CPU usage, which is understandable.
Installing htop
The “htop” package is available on most modern Linux distributions as the package “htop”. For Ubuntu/GridPane folks you can install it using the following command.
apt-get install htop
Storing Historical CPU and Memory Resources over Time (While You’re Asleep)
Now that you’re familiar with reviewing your server’s high resource usage using methods that provide a point-in-time snapshot, what about tracking resources over time to be reviewed at a later date? There are several tools and techniques available, which I’ll detail below.
1. Linux ‘atop’ command
The Linux atop command is a small and efficient tool for logging snapshots of your system in a top-like format over time. Allowing you to review your server’s processes back in time.
Atop is an ASCII full-screen performance monitor which can log and report the activity of all server processes. One feature I really like is that atop will stay active in the background for long-term server analysis (up to 28 days by default).
https://haydenjames.io/use-atop-linux-server-performance-analysis/

Installing atop
The “atop” package is available on most modern Linux distributions as the package “atop”. For Ubuntu/GridPane folks, you can install it using the following command.
apt-get install atop
Configuring atop
Once atop is installed, you will need to ensure that it is running as a service and that it starts on boot if your server is rebooted.
systemctl enable atop
systemctl start atop
By default, atop will take a snapshot every 600 seconds; you may want to bring this down to 300 seconds which you can do so by running the following command.
sudo sed -i -e 's/INTERVAL=600/INTERVAL=300/g' /usr/share/atop/atop.daily
sudo systemctl restart atop
Viewing atop History
You can view the historic data of atop through SSH by running the atop command and providing an atop raw data file. The raw data files are located in /var/log/atop, you’ll see that there is a file generated for each day.
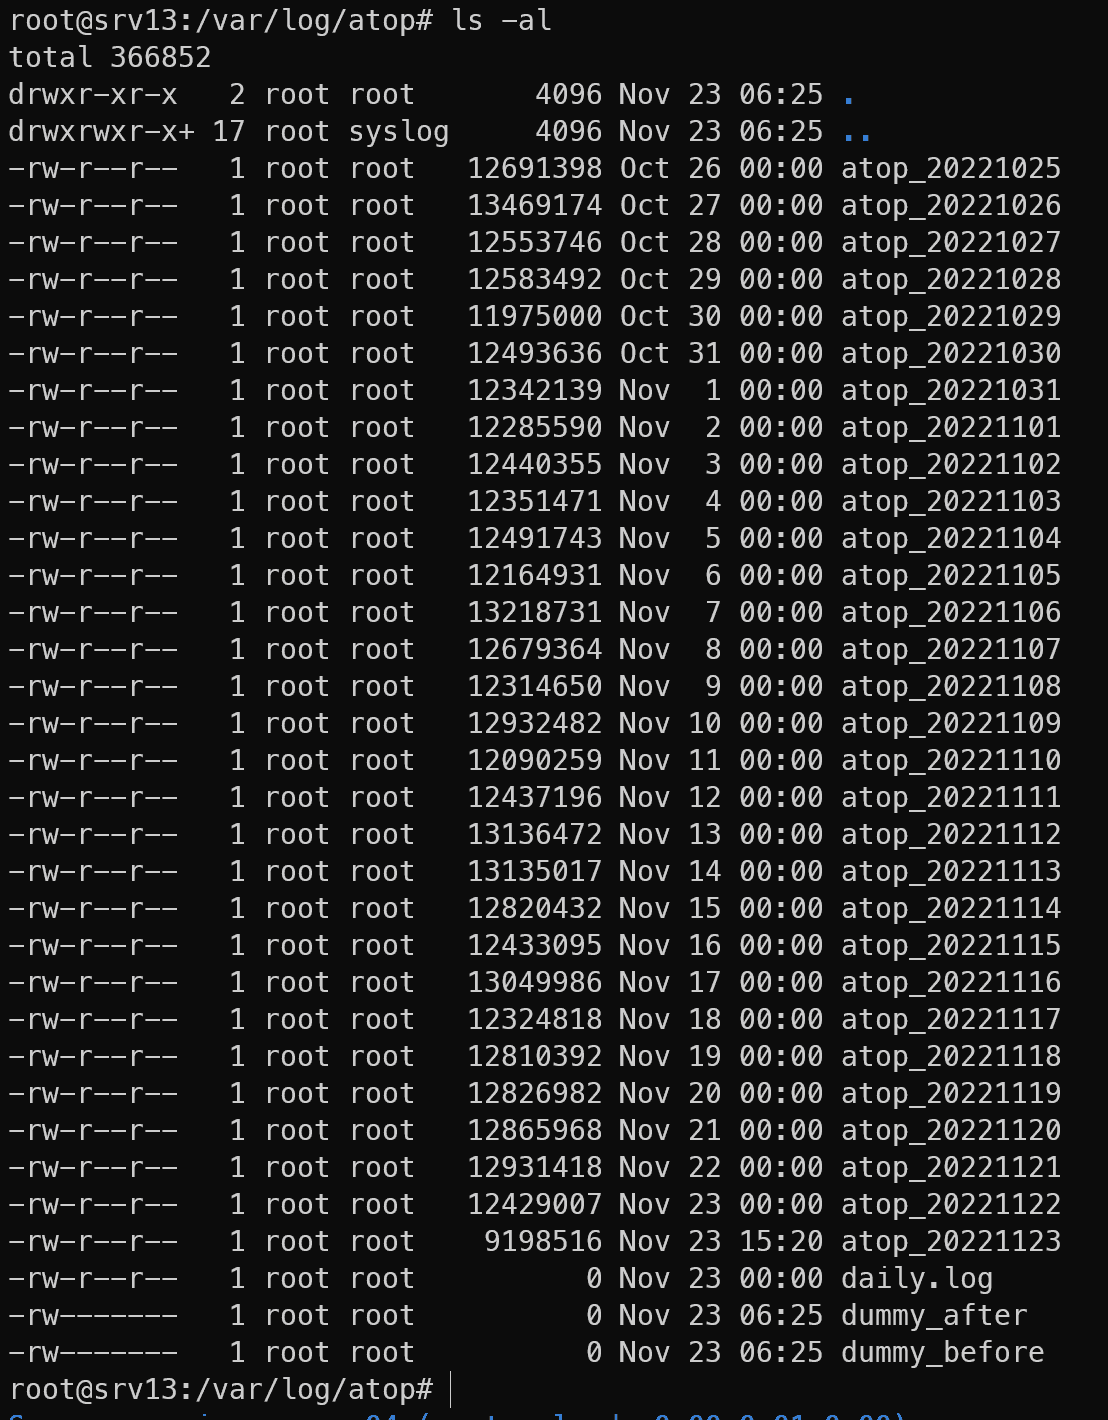
Once inside the /var/log/atop directory, you can then use the atop command with the -r switch to read an atop raw data file.
atop -r atop_20221123

As you can see from the screenshot above, quite a bit of data is shown. You’ll notice on the top left-hand side the date and time. You can move forward and backwards using the following keys:
- t – Show next.
- T (Shift +t) – Show previous.
If you have the date and time of the spike in resources, you can find out what processes were running at that time and hopefully find a culprit that caused the resource increase.
atop Truncated Usernames
Unfortunately atop truncates the username to 8 chars and you can’t change this. There is no option to show the UID either, but you can set atop to not resolve userid’s by passing -l which is available in newer version.
I’ve submitted a ticket requesting the option of setting the column size for UID’s


1.5 Configuring atop Display
You can modify how atop displays information on the screen using the atop rc file located in `~/.atoprc. Here is an example file I use.
- flags: Set specific flags on start-up, flags are the hotkeys to change the display, o activates teh ownprocline.
- interval: How often the display is updated.
- maxlineintf: The maximum number of network interfaces to show, this is important on instances with Proxmox or Enhance where virtual interfaces can be up to 10. It crowds the interface.
flags o
interval 1
ownprocline RUID:200 SORTITEM:18 CMD:1
maxlineintf 1%
2. Netdata
You might have heard about Netdata; free software runs an agent on your server to collect operating system metrics. The agent reports back to the netdata.cloud where it’s processed graphed out, and an email alert is sent out if there’s an issue.

Installing Netdata
You can install Netdata on almost any server; it’s pretty versatile. You visit the Netdata website, sign up and then add a node. You will be given a command to run on your server as root. There may be special considerations when using platforms like GridPane or Runcloud.
Installing Netdata on GridPane
Below is a guide on how to install Netdata on GridPane.

The guide doesn’t cover enabling MySQL, Nginx or PHP-FPM, which require additional server configuration.
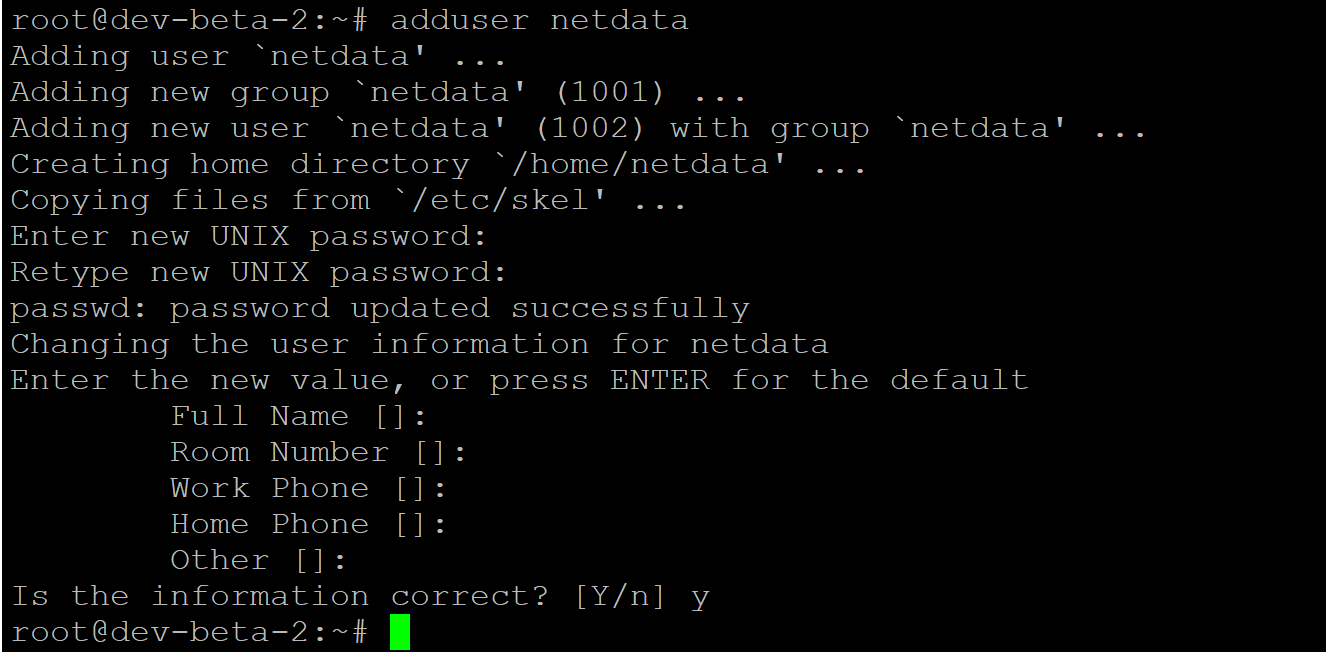
Note About GridPane System Users and Sites
You’ll want to ensure that every site has its own system user, not only because it’s important for security, you can then see each site’s CPU usage under User->CPU and identify if a single site is the cause of the high CPU usage.
Installing Netdata on Runcloud
I have not installed Netdata on Runcloud. However, it shouldn’t be much different than GridPane. You will likely need additional configuration to enable MySQL, Nginx and PHP-FPM.
Monitoring and Alerting CPU and Memage Usage
At this point, there a couple of products out there. Netdata which has already been mentioned, there is also monit which you can use a custom script that can trigger an alert if certain conditions arise. Gridpane has this built in, but you can go a step further with a custom monit module.
Changelog
- 05-15-2025 – An overhaul of ps, addition of ps-top code, updated atop and htop with additional information about usernames being truncated.
- 08-28-2023 – A bit of an Overhaul and a section about PHP Workers.
- 03-31-2023 – Fleshed out Netdata section.
- 11-23-2022 – Renamed article to include memory as well as CPU. Added section on reading atop history.
This page has had its content updated on May 15, 2025 EDT by Jordan

Jordan Trask
With 20 years of experience in technology spanning Linux, Data Center Infrastructure, and related services and applications, Jordan consults with small, medium, and large organizations tackling technology problems and needs. With 10 years of experience in WordPress, he’s created Managing WP as a means of dumping his brain on the web.
Jordan operates LMT Solutions providing Technology Consulting Services and We Power WP for WordPress Care Plans and Support.
This page has had its content updated on May 15, 2025 EDT by Jordan


